 For full access to all OER Project resources AND our amazing teacher community,
By Eman M. Elshaikh, OER Project Team
In our social studies classrooms, we ask students to make comparisons all the time. Almost every student has filled out a compare and contrast graphic organizer at some point. Yet many students struggle with comparison activities. Often, students don’t even know where to start. That’s partly because comparison is a actually a complex process, one that involves multiple steps. Helping students understand the components of a comparison empowers them to make their own comparisons and to think critically about those they encounter in the classroom and beyond.
The Cold War offers an excellent opportunity to think through the different components of a comparison. As the Soviet Union and the United States vied for dominance, propaganda from both sides featured numerous comparisons. Through comparisons, each superpower created a narrative that depicted their society, economy, and political form as superior. For example, the 1948 American cartoon Make Mine Freedom celebrated American systems. It used numerous comparisons to do so. Let’s use this primary source to break down the elements of a comparison.
The elements of comparison
The first and most obvious element of a comparison: what two or more things are you comparing? In this cartoon, the United States is compared to the rest of the world or to some unnamed elsewhere. Although not directly named, this “elsewhere” is probably the Soviet Union.
But this cartoon doesn’t compare the weather of these two countries or contrast their longitudes and latitudes. That brings us to the second element: what qualities are we comparing and contrasting? Often the qualities aren’t given to us! We make choices when we compare because we select which qualities to focus on. But once we’ve done that, we make another choice: how should we organize the differences in these qualities? We do so along some axes of differences.
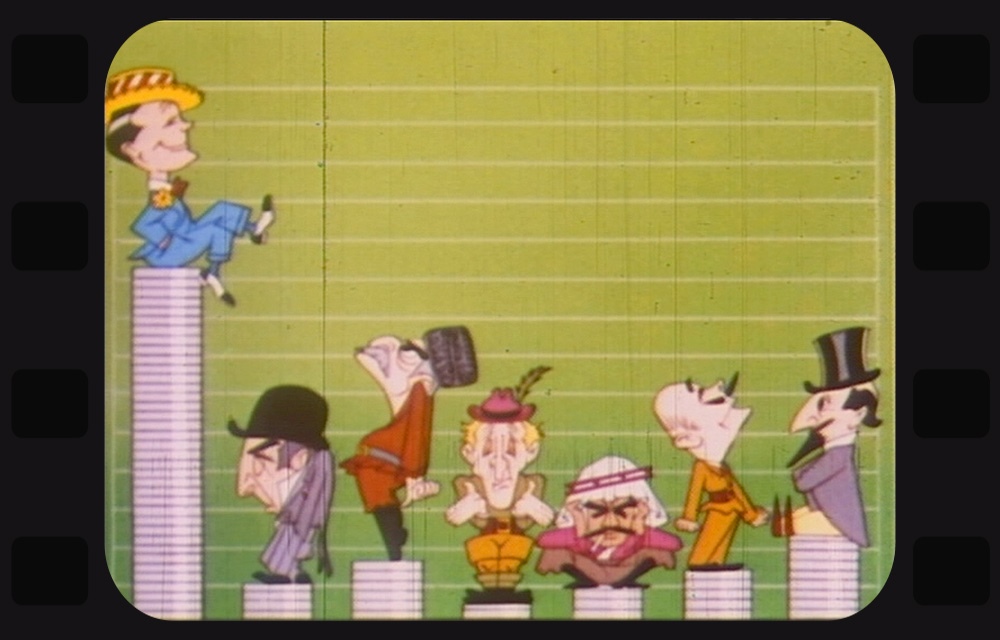 Make Mine Freedom: “Our country has a national income equal to the total national incomes of any other six nations in the world.” © Prelinger / Archive Films: Creative / Getty Images.
For example, in the frame above from our cartoon example, we’re told that the national income of the United States is equal to the “total national incomes of any other six nations in the world.” What’s being compared? The United States and any other country—or any group of six of them. What qualities are being compared? Total national income. How are the differences in that quality organized? Quantitatively, with a coin representing some unit of income.
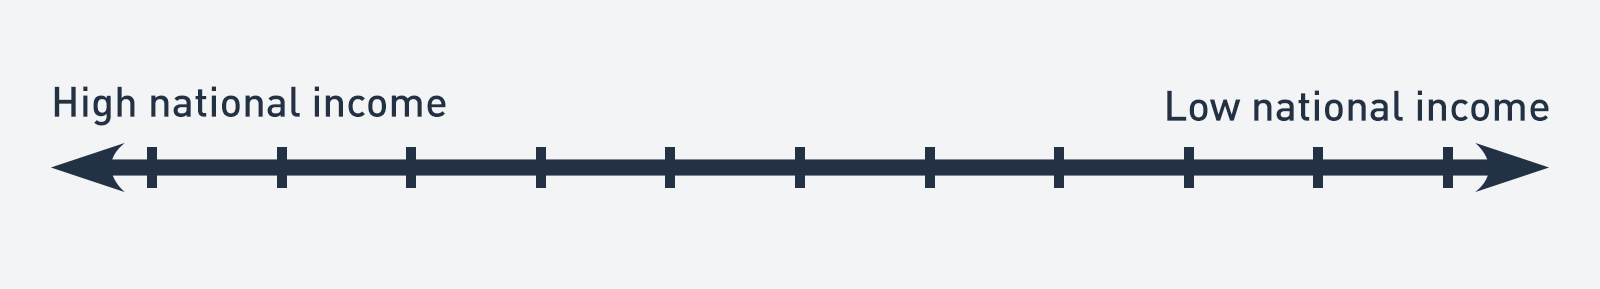
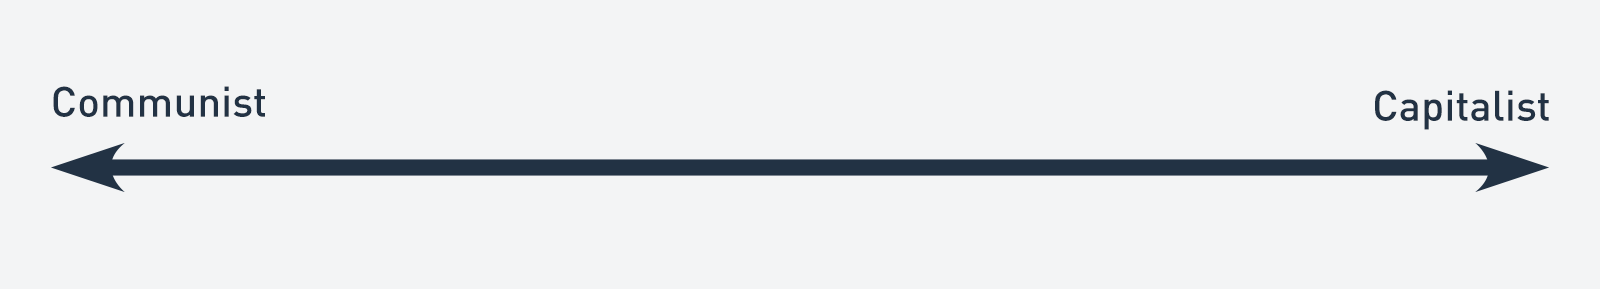
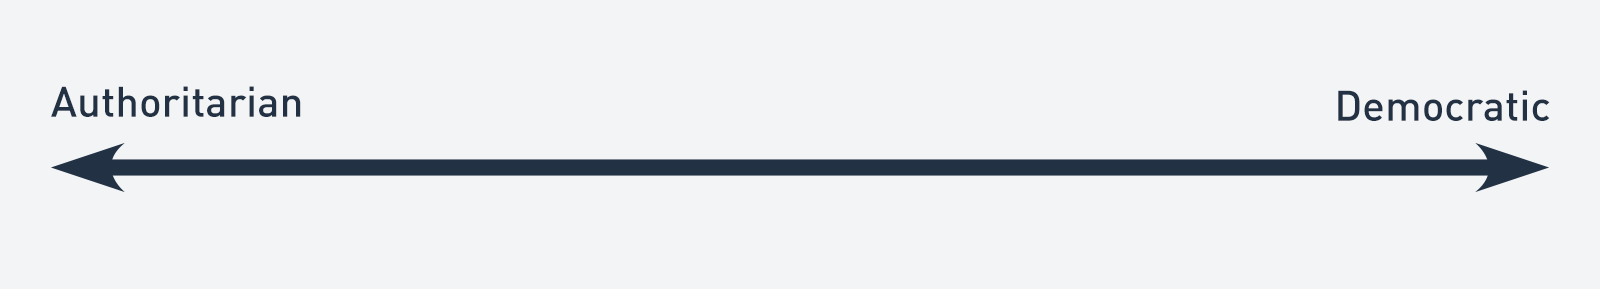
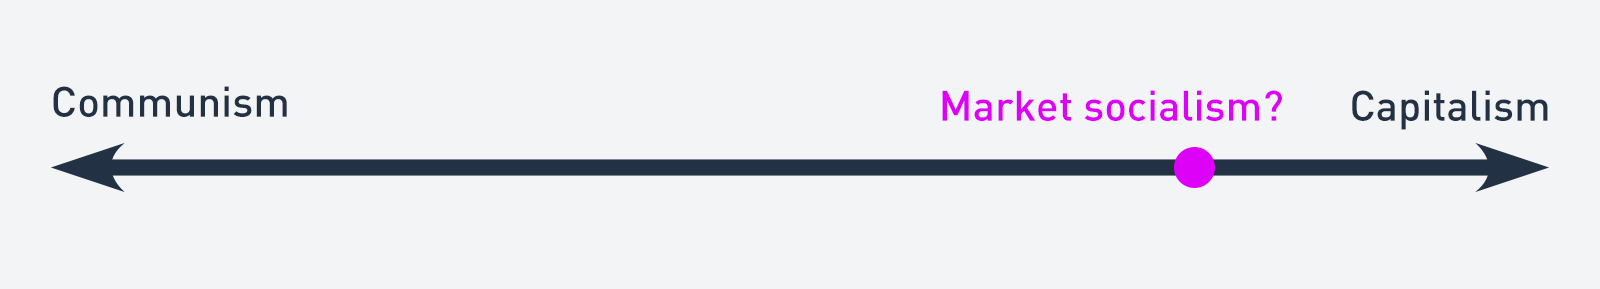
In a chart like this, the axes are obvious. But comparisons don’t always take the form of charts or tables. Even so, we can figure out what differences and units are implied in a comparison by asking what quality is being compared, and how do we organize the differences in that quality? Perhaps the qualities on a given axis are opposites, such as up and down, or as in the case of the Cold War, communist and capitalist. But they can also lie on a spectrum such as national income. There can also be different types. Instead of a national income spectrum, for example, we might organize wealth by sorting countries into categories such as First, Second, or Third World. Qualities can be mutually exclusive or matters of degree.


In another example from this cartoon, education rates are compared. The narrator tells us that the number of American students who reach high school and college exceed the number of students in “all the rest of the world combined.” What’s being compared here? American access to secondary and higher education versus access in the rest of the world. How are we measuring and organizing that access? By representing the number of students who reach high school or college in each country. In the picture, height indicates higher education.
Note that we aren’t comparing how many students graduate or the quality of their schooling or their performance on standardized tests. We don’t know anything about that. We could choose any number of qualities to compare education systems and could select any number of indicators to organize the differences in this quality.
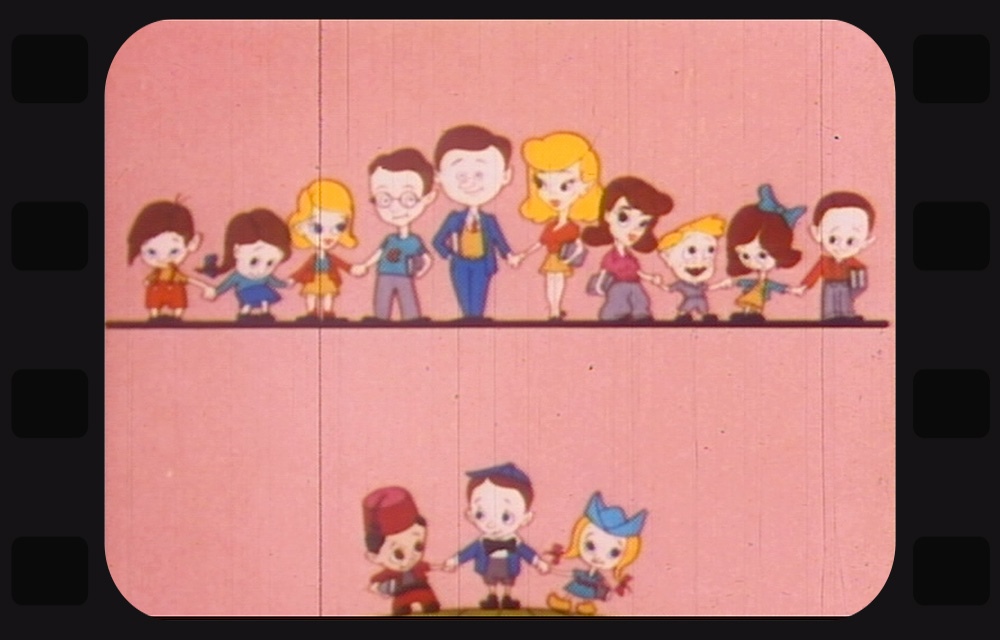 “We’ve built a country under the American system that sends more young people to high school and college than all the rest of the world combined.” Make Mine Freedom, 1948. © Prelinger / Archive Films: Creative / Getty Images.
How do comparisons fit into narratives?
Make Mine Freedom leverages these comparisons to convince us that the American way is the best way. Narratives like these are often full of comparisons, and comparisons themselves are sometimes made up of stories—like stories about children reaching high school or college. In this narrative, America leads not only in national income and education access, but also in guaranteeing different rights. For example, in the two frames below, we can see an American man refusing entry to police officers, while later in the cartoon, a non-American businessman is forcibly removed from his place of work by the all-powerful hand of the state.
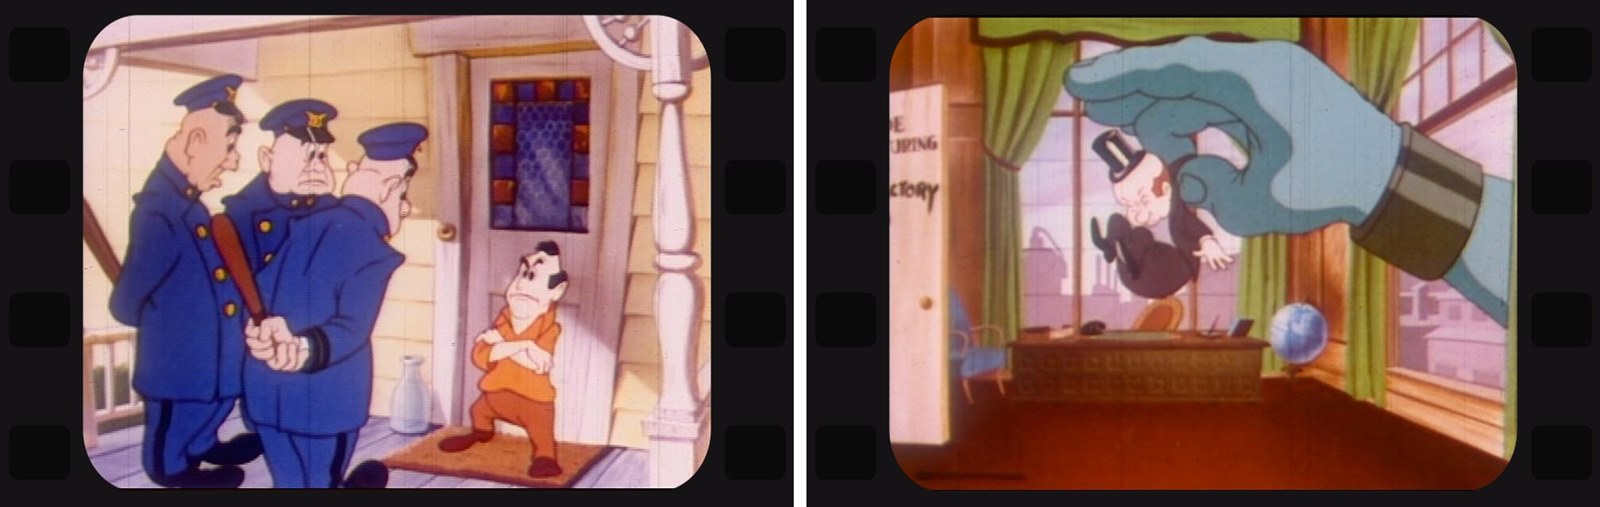
Left: American man refusing entry to police officers. Right: Non-American being removed from his office by the hand of the state. Make Mine Freedom, 1948. © Prelinger / Archive Films: Creative / Getty Images
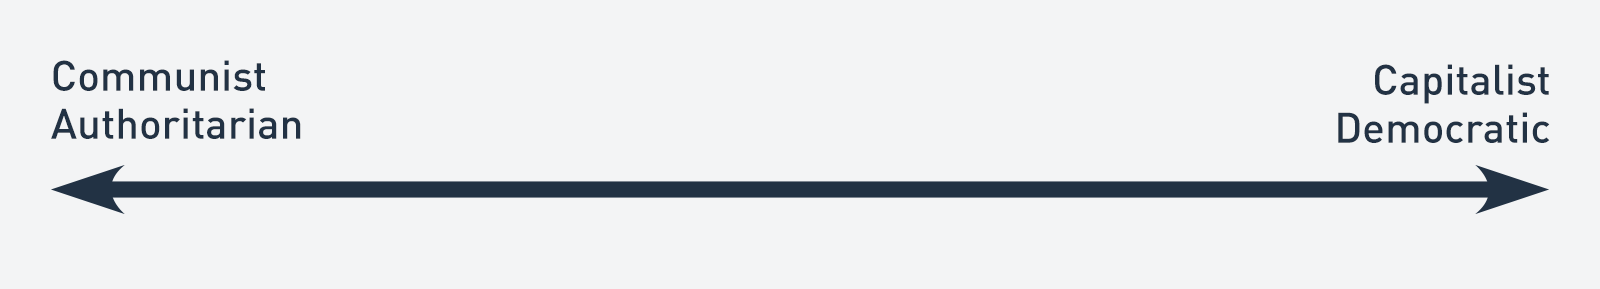
As comparisons are linked together, they’re sometimes stacked, and we can start to see these axes converge. For example, comparisons between economic systems and political systems are often conflated, and we start to see them as all part of the same comparison, even when they’re not. In fact, scholars have shown that economic freedom doesn’t always correlate with political freedom.
Using the elements of comparison
We have identified three key elements of comparison: the things being compared, the qualities that are used to compare them, and how we organize the differences in these qualities. Identifying these helps students make and evaluate comparisons more carefully and critically. Specifically, it helps students to:
- Notice when comparisons are getting stacked. That helps them pull apart the comparisons and evaluate them individually—and perhaps question the links.
- Question what is being compared. In this case, they may throw China into the comparison, or wonder about how nonaligned countries complicate the comparison—or the axes.
- Question the qualities that are being compared. What if we compared the US and USSR based on energy use or literacy rates? What if we compared their space programs or poverty rates?
- Question how differences in a quality are organized or measured. Students may wonder whether communism and capitalism are ends of a spectrum or two poles with no in between. They may also try to measure a quality differently, like by focusing on distribution rather than a total.
- Switch perspectives. Students might ask, how might a Soviet propaganda cartoon make different comparisons from a Soviet perspective? Soviets might, for example, highlight wealth distribution or economic equality instead of total national income.
- Switch scales. In response to this cartoon, a student might wonder whether the good American life was the same for all Americans across social classes, racial groups, genders, or regions. What happens if we zoom in on specific communities or cities? For instance, were all Americans free from unreasonable search and seizure? Did they all have the same access to secondary and higher education?
Comparisons are powerful, and they are part of powerful narratives. Teaching students the different components of a comparison gives them some of that power so they can ask questions about the comparisons they hear and even come up with new, creative comparisons. Then, students can gather different data from places like Our World in Data—and perhaps come up with their own graphic organizers.
About the author: Eman M. Elshaikh is a writer, researcher, and teacher who has taught K–12, undergraduates, and graduate students in the United States and in the Middle East. She teaches writing at the University of Chicago, where she also completed her master’s in social sciences and is currently pursuing her PhD. She was previously a World History Fellow at Khan Academy, where she worked closely with the College Board to develop a curriculum for AP World History.
Citation: Make Mine Freedom, by Sutherland (John) Productions, United States, 1948, Public domain, https://archive.org/details/MakeMine1948
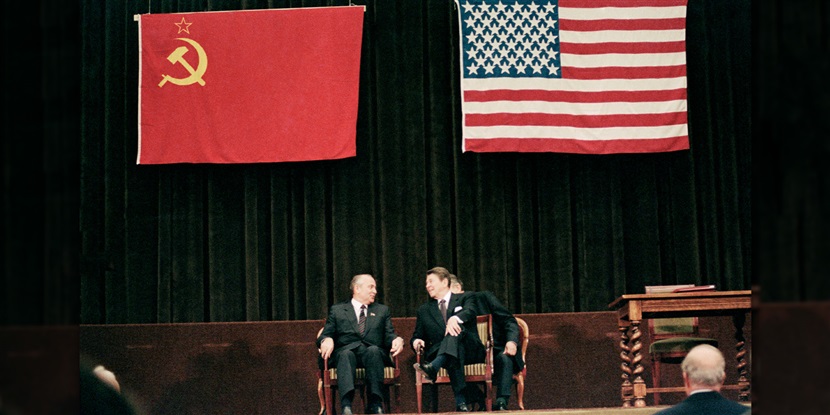
Cover image: Soviet-U.S. Summit. At center stage, both at the International Press Center and in the world scheme of things, Soviet leader Mikhail Gorbachev and U.S. president Ronald Reagan smile during concluding summit ceremony. © Bettmann / Getty Images.
-

John Vidoli
-
Cancel
-
Up
0
Down
-
-
Reply
-
More
-
Cancel
Comment-

John Vidoli
-
Cancel
-
Up
0
Down
-
-
Reply
-
More
-
Cancel
Children