 For full access to all OER Project resources AND our amazing teacher community,
By Rachel Phillips, OER Project Team
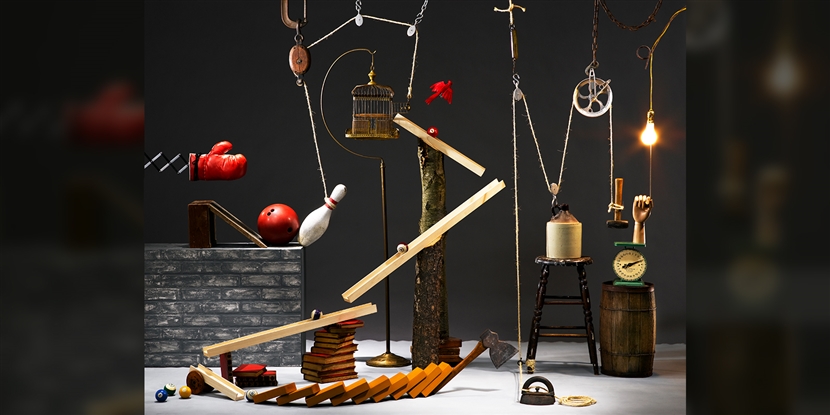
Of all the historical thinking skills we want our students to develop, causation is one of the most important. But the past is messy and complex, and it’s easy for students to get lost or oversimplify as they learn causation. By the time students encounter the causation progressions in our courses, they probably think they understand cause and effect—you knock down one domino, and the rest will start to fall. Simple, right? Not quite. Cause and effect is not simple, and history (never mind real life) isn't as predictable as a domino run. We often need to confront this common misconception about causation and help students see that historical events are often very complicated and rarely (if ever) have a single, immediate cause. So how do we do this? Why not give them a causal map—or better yet, have them create such a map?
Causal maps are a type of concept map, or technique for displaying and organizing the information that surrounds events and processes. They are a great tool for helping students visualize historical causation, which, as we know, can be pretty messy. They can also help nonlinear thinkers share their ideas visually and move linear thinkers away from monocausal thinking. By taking a historical event and mapping it out, students really start to grapple with the idea of multiple causation, which complicates the relationship between causes, effects, and how they interact.
Here is a simple causal map from the WHP activity Causation – Revolutions, but they can certainly get more detailed.
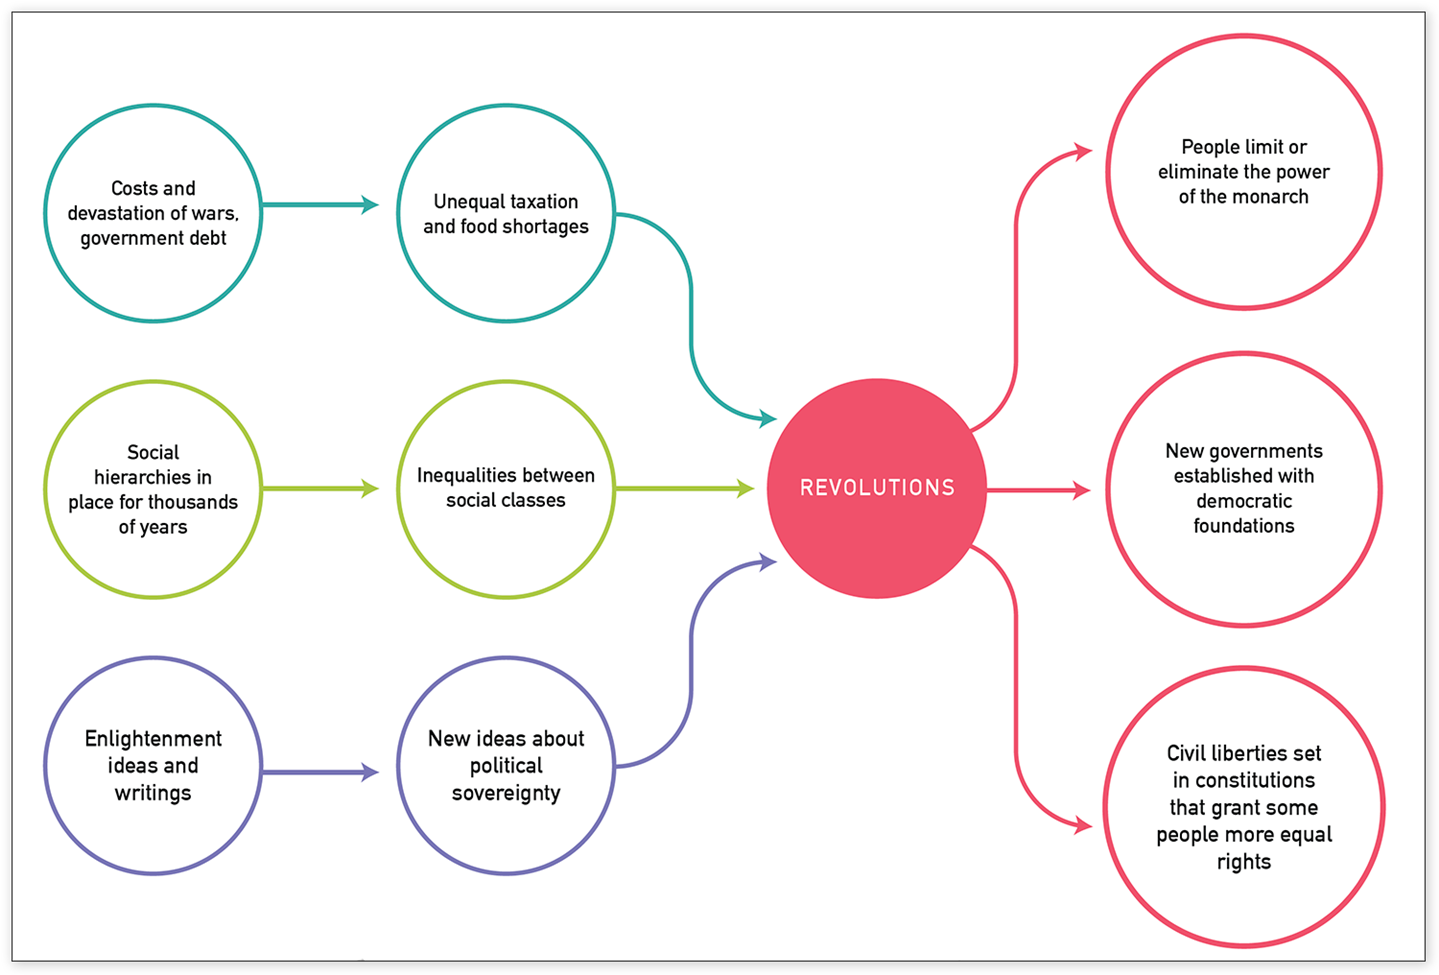 Revolutions causal map
Causal maps have nodes (in this case the contents of each circle) and connections between the nodes that show cause or influence. Adding more nodes and connections is one way to add dimension. Students can also add detail by including dates, sources and evidence, and visual elements (such graphics or data representations) as well as categorize the causes by role, significance, and type. Integrate some art into the activity by letting students get creative with their nodes, connections, and labels.
Causal mapping offers lots of opportunities—you could have small groups each map out a historical event, giving each group different periodization to examine around that event. For example, imagine you want to ask students to map out the causes of Modern Revolution as an extension to the Big History activity Causation – The Modern Revolution. Assign one group to begin mapping in 1900, another in 1200, and a third starting with the Big Bang, so students can compare differences when you play with periodization and scale. (You might also want to assign a minimum number of nodes to each group or the 1900 map could have a lot less detail.)
If you are a World History teacher, you could first have students map out the Black Death like they do in the WHP 1200 course activity Causation – The Black Death. Then, to extend this further, you could have them compare what they learned from the articles in the activity with some new research from Monica Green that provides a slightly different timeline and causes for the Black Death. (You could also use Bennett Sherry’s blog about the Black Death, which summarizes Green’s work.)
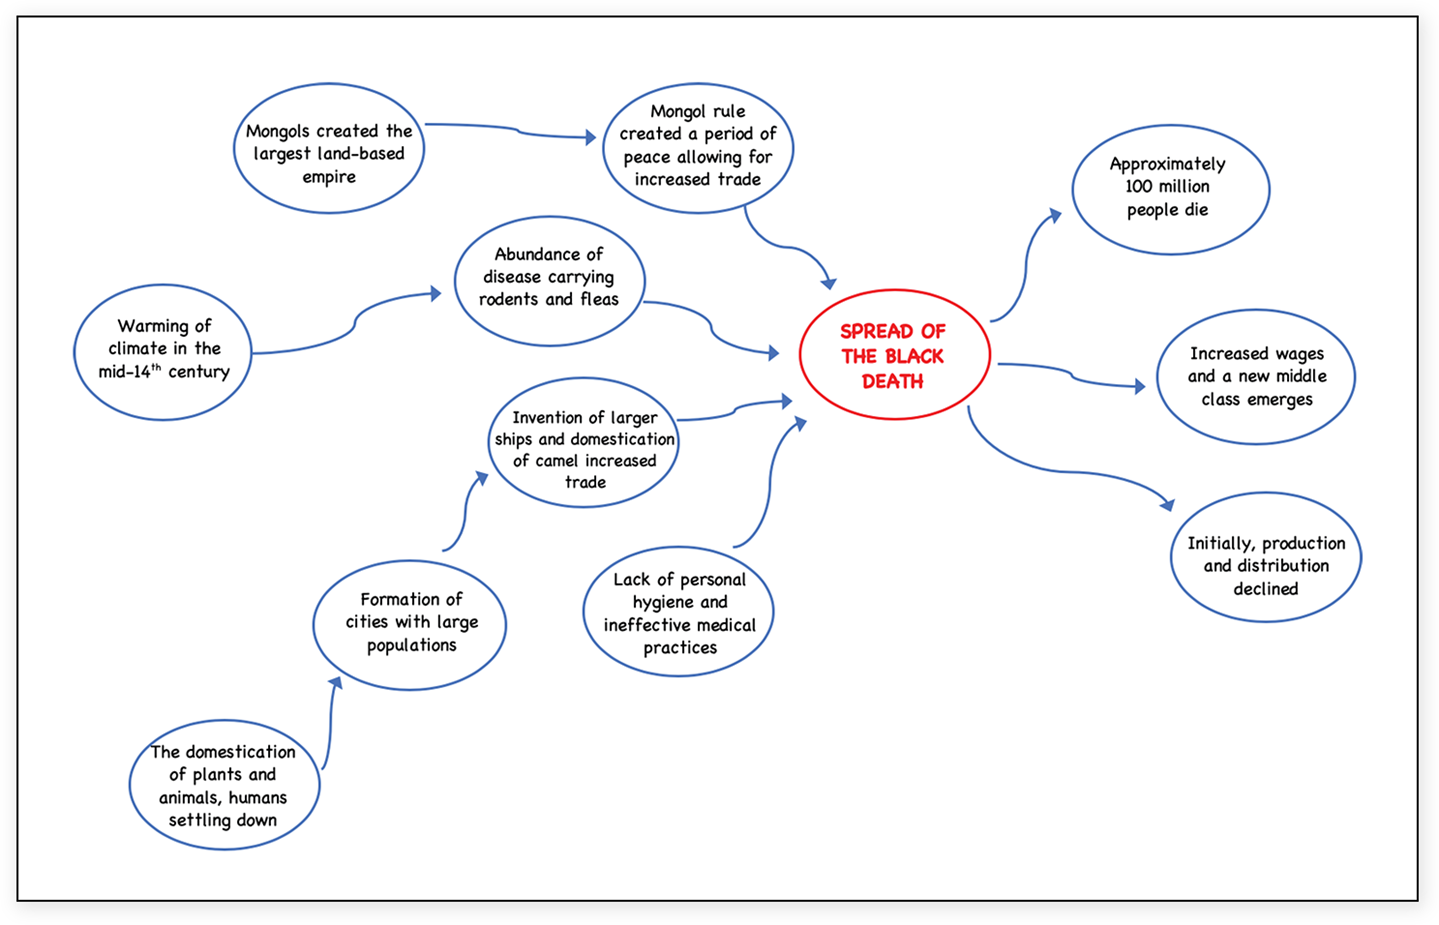 Black Death causal map
Another way to make things fun and memorable is to have students act out the causal maps. Have some students be the nodes and others the connectors, and you could even get creative with significance, role, and type and how you choose to represent the nodes and connectors. Your students might have a good time coming up with ideas for acting out the triggering event!
If you haven’t tried causal maps yet, we highly recommend getting out some butcher paper and markers, and giving your students a change to map out causes. You can use any of the causation progression lessons in any of the courses, but you can also try out some other approaches. If you’re a Big History Teacher, you could start a class project where students map out the history of the world from the Big Bang to today, adding to it as they reach new thresholds and gather more information. (You’ll need a pretty big roll of butcher paper for that one.) For teachers of any course, causal maps can be a simple, effective, and fun review activity—at the end of a unit or the school year, give students a chance to collaborate on large causal maps that will also be great for content review!
What is your favorite way to do causal mapping? Have you ever tried the live version? Please share your successes (and any words of caution you might have) with us in the OER Project Online Teacher Community!
About the author: Rachel Phillips, PhD, is a learning scientist who leads research and evaluation efforts for the OER Project, as well as develops curriculum for their courses. She is elementary certified, has taught in K–12 schools, and currently serves as an adjunct professor for graduate courses in American University's School of Education. Rachel was formerly Director of Research and Evaluation at Code.org, faculty at the University of Washington, and program director for National Science Foundation-funded research. Her work focuses on the intersections of learning sciences and equity in formal educational spaces.
Cover image: Rube Goldberg Machine. © Jeffrey Coolidge / Getty Images.
Top Comments